

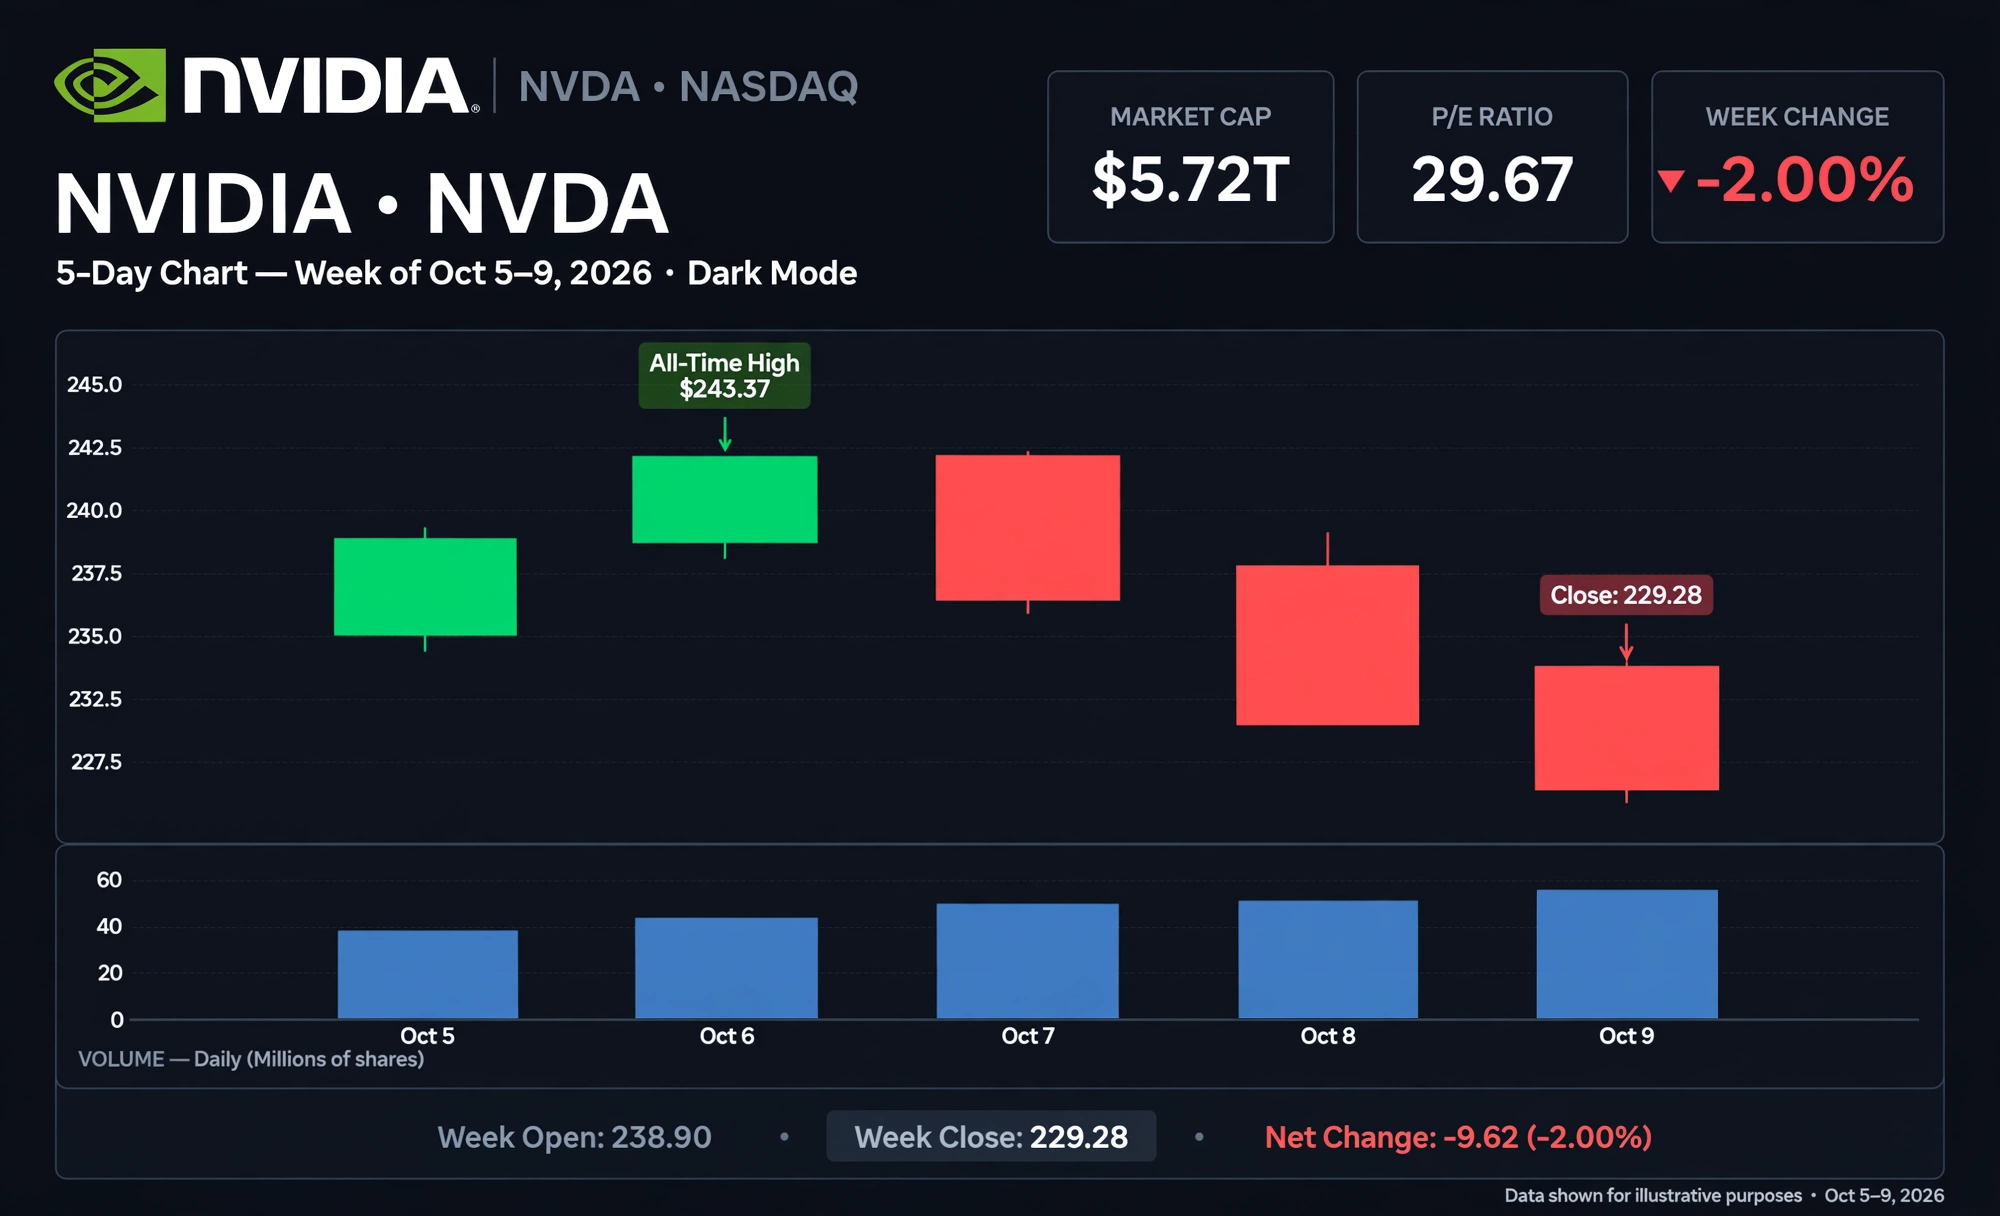
As of close Friday, October 9, 2026 • NASDAQ: NVDA • Price: $229.28
Performance Snapshot
- Close Friday: $229.28, down -0.52% on day (-$1.20), Open $233.835 High $233.92 Low $229.11 Volume 84.44M
- Week: -2.00% 5-day return per Finnhub, but +2.12% to +2.90% swings intra-week. 1-Month +5.03%, 6-Month +21.55%, YTD +22.94%, 1-Year +25.18%
- 52-Week: $164.27 - $243.37 (NEW ATH this week) | Market Cap $5.53T - $5.77T, near $6T | P/E 29.67, Beta 2.25
- Daily Breakdown: Oct 5: $233.95 → $238.90 +2.12% (126.57M), Oct 6: $238.90 → $239.24 +0.14% ATH $243.37 (100.82M), Oct 7: $239.24 → $237.36 -0.79% (81.41M), Oct 8: $237.36 → $230.48 -2.90% (118.24M), Oct 9: $230.48 → $229.28 -0.52% (84.44M)
What Drove The RISE Early Week?
1. New All-Time High & $6T Near-Miss: On Oct 5 closed at ATH $238.90 after touching $240.10 intraday, cap ~$5.76T-$5.8T. Oct 6 opened ~$242 and hit $243.37, implied cap $5.84T, 4% away from first $6T company ever. Added ~$1.2T market value YTD, up ~28% YTD, single largest contributor to S&P 500 +14% gain.
2. Buyback + Earnings Power: Sept 28 board added $150B to repurchase, largest in history, total remaining $235B through FY2028 (2.8% of shares). Q2 ended July revenue $96.22B (+105.9% YoY) beating $92.27B est, EPS $2.22 vs $2.09 est, Data Center $89B (+117% YoY) = 90%+ of total, margin ~75%, ROE 96.04%, net margin 63.66%. Guidance next quarter $106B-$110B.
3. Blackwell Ultra & Vera Rubin Demand: Blackwell Ultra ramping, Vera Rubin in full production. Foundry partner TSMC record revenue confirmed robust GPU demand, dispelling advanced packaging delay fears.
What Led To The FALL Late Week?
1. Failed Breakout / Profit Taking: Second record without confirmation - printed new high in 243 area then slid back to close week -2% near low. Technical: stays in open buy signal (+2.38% from signal) but weekly MACD weakening again after last week's improvement. StockInvest notes volume declining on rising prices as divergence warning, price action calls for caution.
2. Broader Market & AI Cash Crunch Fear: Nasdaq pulled back, XLK Tech ETF -0.5% on week. Headline Oct 9 that big tech needs $7.9T by 2031 to break even on AI. NVDA -2.94% mentioned in that report alongside MSFT -1.35%, AMZN -2.26%. Investors shifting debate from demand to constraints: power, financing, data center space to deploy accelerators.
3. Supply Chain Noise: HBM3e supply concern from Micron Taiwan labor dispute briefly weighed, later eased after Cantor Fitzgerald said shortage and pricing power unchanged - Micron and SK Hynix rebounded, sentiment improved, dip-buyers stepped in pre-market Oct 9 +2% to $234.27 snapping 3-day losing streak.
Sources
- Finnhub - NVIDIA Corp (NVDA): Current $229.28 Open $233.835 High $233.92 Low $229.11 Prev Close $230.48 Change -0.5207%, 5D -2%, 1M +5.03%, 52W $164.27-$243.37, Market Cap $5.72T, P/E 29.67, Beta 2.25, EPS $4.8979 [finnhub.io]
- MarketBeat - NVDA Price History: Oct 9 $230.48→$229.28 -0.52% $233.92/$229.11 84.44M $5.53T, Oct 8 $237.36→$230.48 -2.90%, Oct 7 $239.24→$237.36 -0.79%, Oct 6 $238.90→$239.24 +0.14% High $243.37, Oct 5 $233.95→$238.90 +2.12% High $240.10 [marketbeat.com]
- StatMuse - NVDA Last 1 Month: Returned 3.6% Sep11-Oct11, Oct 9 $233.84/$233.92/$229.11/$229.28 84.6M, Oct 8 $234.92/$237.07/$229.85/$230.48 118.6M, Oct 6 $242.10/$243.37/$238.93/$239.24 [statmuse.com]
- Crowdfund Insider - NVDA Nears $6T Market Cap: Oct 5 close $238.90 ATH after $240.10, Oct 6 opened ~$242 briefly $243.37 cap ~$5.84T, adds $1.2T YTD +28% YTD, S&P 500 contributor, Qtr revenue $96.2B double YoY, Data Center $89B +117%, guidance $106-110B, margin 75%, buyback $150B added to $235B remaining [crowdfundinsider.com]
- TradingKey - NVDA Gains Nearly 2% Intraday Oct 9 pre-market $234.27 snapping 3-day losing streak, Oct 6 surged $243 intraday record, pulled back Oct 8 -2.90% to $230.48, TSMC record revenue confirms Blackwell/Hopper demand, HBM3e supply eased after Cantor Fitzgerald [tradingkey.com]
- AI Trading 67 - Nvidia slips 2% after new record 243 area: breakout still lacks confirmation Oct 9, prior week +3.9% more than 2x XLK, 230 area now behind, open buy signal, weekly MACD weakening, 2.4% since entry, signal strength 55/100 [aitrading67.com]
- MarketBeat - Week in Review 10/05-10/09: NVDA opened $229.28 Friday, market cap $5.53T, P/E 28.99, PEG 1.77, beta 2.22, 50-day $222.66 200-day $209.43, 1Y low $164.27 high $243.37, EPS $2.22 beat $2.09, ROE 96.04% net margin 63.66% revenue $96.22B vs $92.27B est +105.9% YoY [marketbeat.com]
Disclaimer: Not financial advice. Data as of Oct 9-10, 2026. Verify with official brokerage.
NVIDIA (NVDA) Stock Performance: Last Week Overview
During the week of October 5 to October 9, 2026, NVIDIA (NASDAQ: NVDA) experienced a period of initial momentum followed by late-week market consolidation, ultimately closing flat to slightly down for the week.
- Weekly High: ~$242.22 (Intraday peak on Tuesday, Oct 6)
- Weekly Low: ~$229.11 (Friday, Oct 9)
- Friday Close: $229.28
- Weekly Net Change: -0.13% overall shift from the previous week's close
Key Drivers: What Led to the Rise and Fall?
1. Early-Week Rise (Monday, Oct 5 – Tuesday, Oct 6)
NVIDIA began the week on a strong upward trajectory, climbing past $240 and reaching mid-week highs near $242.22.
- AI Infrastructure & Next-Gen Architecture Demand: Sustained market enthusiasm surrounding next-generation AI GPU roadmaps (including the Rubin architecture ramp) and strong enterprise cloud demand drove strong buying pressure.
- Optimistic Q3 Projections: Investor confidence was bolstered by elevated market projections for Q3 hardware supply expansion and hyperscaler capital expenditure.
2. Late-Week Pullback (Wednesday, Oct 7 – Friday, Oct 9)
After peaking on Tuesday, NVDA gave back its weekly gains, closing the session on Friday at $229.28.
- Profit-Taking at Resistance: After pushing near historical high resistance levels ($240–$243 range), institutional investors engaged in short-term profit-taking.
- Broader Market Consolidation: Tech indices saw broader macroeconomic headwind pullbacks and sector rotation heading into the weekend, dampening high-beta semiconductor momentum.
Sources of Information
Data and analytical insights referenced in this report were gathered from the following financial tracking and market analysis platforms: